Your Microsoft Dynamics GP solution helps you make decisions that positively affect your bottom line. To make those decisions, you need up to date reporting. The Management Reporter application does that by giving you the ability to create, distribute, and analyze financial reports. Pulling general ledger data from your Microsoft Dynamics GP installation, this powerful tool gives decision makers real-time access to information. Analyzing the reports will give you the ability to make smart decisions, and take quick, corrective action.
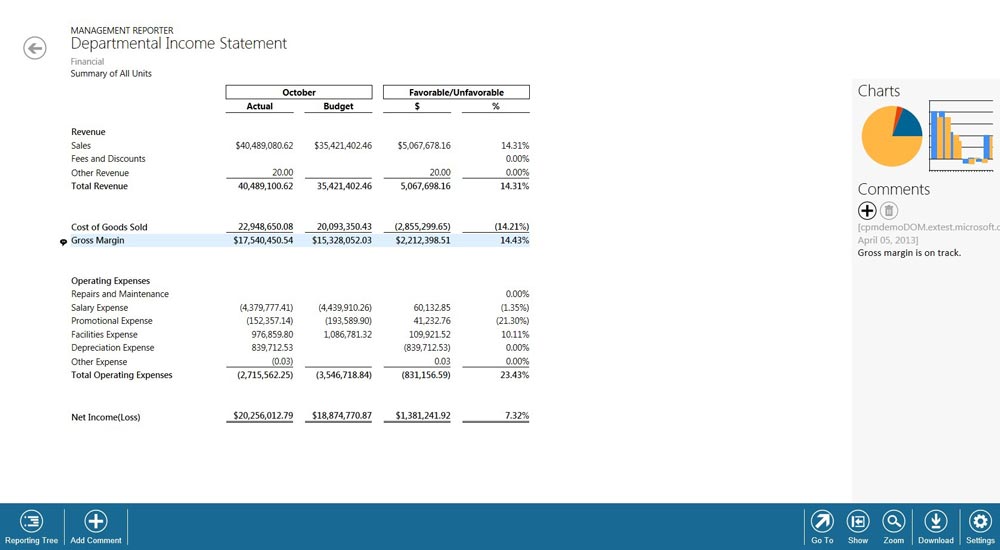
The web viewer screenshot below shows a departmental income statement report with charts and comments.
Although you can design many specialized reports in management reporter, the application is loaded with twenty-two default reports which may be all you need. The reports included are:
- 12 Month Rolling Single Column Income Statement
- 12 Month Trend Income Statement
- Actual vs Budget
- Audit Details
- Balance List
- Balance Sheet
- Balance Sheet and Income Statement Side by Side
- Cash Flow
- Detailed JE and TB Review
- Detailed Trial Balance
- Expense Three Year Quarterly Trend
- Financial Captions JE and TB Review
- GL Detail
- Income Statement
- Ledger Transaction List
- Ratios
- Rolling 12 Month Expenses
- Rolling Quarter Income Statement
- Side by Side Balance Sheet
- Summary Trial Balance
- Summary Trial Balance Year Over Year
- Weekly Sales and Discounts
If the list above seems intimidating, start with the basics: the Balance Sheet to get a snapshot of your financial position, the Income Statement to understand your profitability, the Cash Flow Statement to see which areas are generating the most cash, and the Actual vs Budget to see whether your company is meeting your financial projections.
Rather than starting from scratch, eliminate the time-consuming work of financial report creation by personalizing the default reports with your company information. That way you can spend more time
sharing reports with company stakeholders and making informed business decisions.


