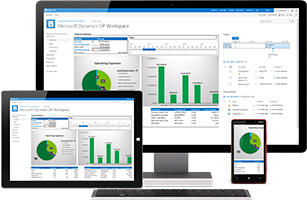
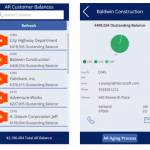
Whether your company’s data is on premises on in the cloud, using the Power BI suite of business analytics tools with the latest version of Microsoft Dynamics SL 2018 will let you analyze and report on data from many different sources. You will be able to create reports and display the results easily, facilitating ad-hoc analysis. Reports can be published on the web or viewed on mobile devices. Users can create a personalized dashboard to give themselves a detailed and unique view of the business. Reports that used to take hours or days can now be completed in minutes.
To access Power BI, download the free app from the Microsoft site.
Launch the app, select the Get Data icon and you’ll see a list of potential data source types. There are several ways to report on data from Microsoft Dynamics SL. One way is to export data from a Dynamics SL 2018 database to create an Excel Spreadsheet. A report can then be created in Power BI from the spreadsheet.
Another way to report on MS Dynamics SL data is to connect directly to the SQL Server and write a report against the Dynamics SL database. With this method, you can choose to import data or query the data in real time ensuring that it’s up to the minute current.
After you’ve created a report, you must save it to the Power BI desktop. At that point, it can be uploaded and published to the Power BI web service to allow access through a browser.
Reports can be displayed in a wide range of formats. The screen shot below shows a Power BI Dashboard containing views of Labor and Expenses, Month to Date Gross Margin, and Top Ten Projects.
Power BI Dashboard example
Whether you want to look at month to month performance, gross margins, or other indicators, the flexibility and features of Power BI will enhance the reporting capabilities of Dynamics SL 2018 and add value for your users.


